
How to Make Data-Driven Decisions With Clinic AI Reports
Every clinic produces data. Dozens of appointments are created every day, treatments are completed, messages are answered, invoices are issued. The problem is not a lack of data; it is that this data stays scattered in the system without turning into a meaningful decision. How many appointments were cancelled last month? Which treatment brought in the most revenue? Whose calendar filled most often, and which channel’s patients turned into appointments most? The answers to these questions are usually in the system, but pulling them out means collecting data from different screens for hours, processing it in Excel and interpreting it by hand.
13 July 20267 min read
In this article
- What Is a Clinic AI Report?
- How Is the Report Produced? A Step-by-Step Flow
- What Data Does the Report Draw On?
- Breakdowns That Turn Raw Numbers Into Decisions
- Automatic and Regular Reporting
- Which Clinics Benefit Most From AI Reports?
- Frequently asked questions
- The Data Is Already Yours; Reporting Turns It Into Decisions
This process is both time-consuming and error-prone. What is more, as the clinic grows, so does the data; past a certain point, manual analysis either never gets done or gets done incompletely. When a decision has to be made, you are left with gut feeling instead of a clear picture. Flextell’s AI-powered reporting module is designed to close exactly this gap: it gathers data scattered across the clinic’s different modules on its own, interprets it with AI, and gives the clinic manager not just a summary but an actionable insight.
In this guide we walk step by step through how clinic AI reports are produced, what data they draw on, and how they turn raw numbers into real decision support.
What Is a Clinic AI Report?
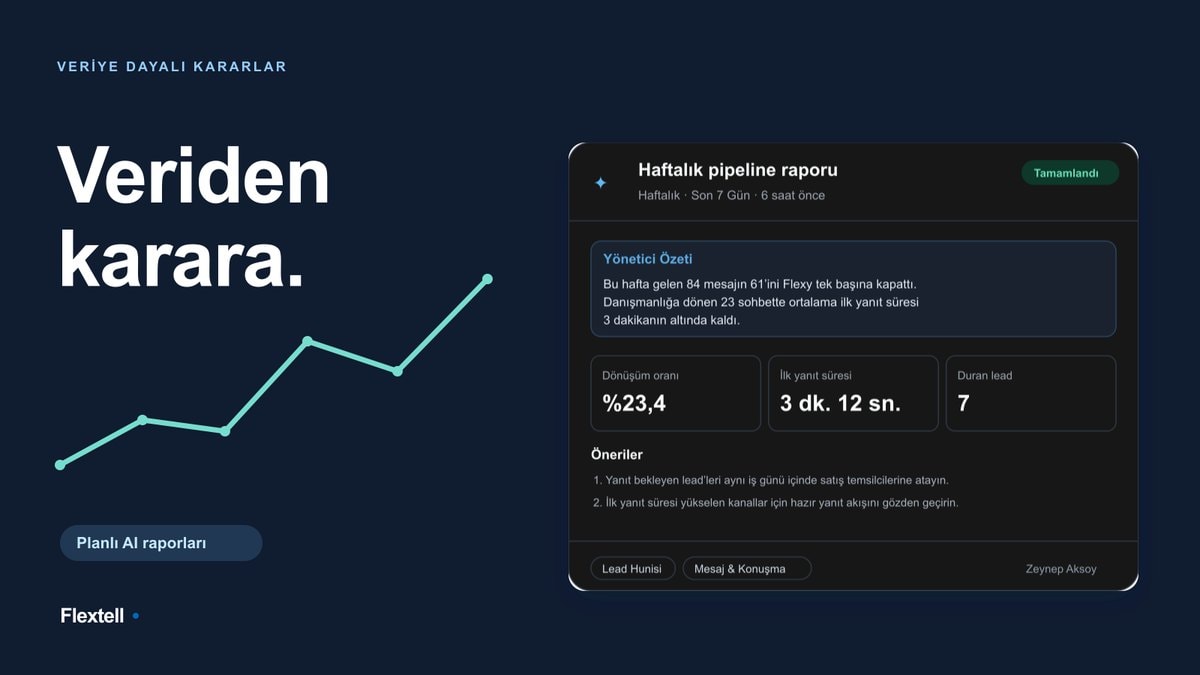
A clinic AI report is a form of reporting that automatically compiles the clinic’s appointment, patient, treatment, revenue and communication data from different system sources, analyzes and interprets that data with AI, and gives the clinic manager insights and recommendations.
An important distinction needs to be made clear here: a classic dashboard lists data. It shows how many appointments there were and how much revenue was earned as a table or chart, and leaves the interpretation to you. An AI report goes a step further. It explains what the numbers mean, points out trends that deserve attention, and produces insights at the level of “this metric dropped, the likely cause may be this, and it would help to look at that.” The difference is similar to the difference between an income statement and a financial advisor’s commentary on it.
In Flextell this report is not a standalone tool; it is part of an AI layer that works integrated with all modules of the clinic platform. The same AI assistant that answers patient messages also reads and makes sense of clinic data in the background.
Want to discover how the clinic AI assistant works across all modules? You can find our guide to the clinic AI assistant here.
How Is the Report Produced? A Step-by-Step Flow
Flextell’s reporting module works in a set flow from the moment a report request is created. Seeing this flow step by step makes it easier to understand why the report is more than a simple summary.
Step 1 — The scope is set. The clinic manager chooses which period (for example the last 7 days, the last 30 days or a custom date range) and which systems (such as appointments, patients, treatments and chat channels) to include in the report.
Step 2 — Data is collected. The system automatically pulls the data matching the chosen scope from the relevant modules. This compilation is limited to the clinic’s own data; each clinic sees only its own records.
Step 3 — The data is passed to the AI. The collected statistics are passed to the AI together with background context (such as the clinic’s record history and total volume). Thanks to this context, even when there is little data, the model does not brush the result off as “no data”; it interprets the data it has in a meaningful way.
Step 4 — A report with commentary is created. The AI evaluates each metric, brings out the points that stand out and draws insights for clinic management. The result is not a raw table but a text that can be acted on directly once read.
Step 5 — The report is saved and shared. The generated report is recorded in the system and can be exported. It can also be scheduled to be produced automatically at regular intervals.
This flow runs from scratch with every report request; the report is always prepared with the latest data.
What Data Does the Report Draw On?
Flextell’s AI reporting draws not from a single source but from all the data scattered across the clinic’s different modules. The report collects data from ten different system sources, including appointments, patients, treatments, doctors, messaging and support requests.
The practical meaning is this: the report sees not just one side of the clinic but its interconnected processes together. It can evaluate appointment fill rate together with revenue distribution, no-show trends together with treatment type, and message traffic together with conversion to appointments. While the data of a single module gives an incomplete picture on its own, combining sources produces a truly holistic view.
There is a critical point here: the accuracy of the report depends on the accuracy of the data entered into the system. When treatments, doctor profiles and appointment records are kept current and complete, the report is accurate to the same degree.
Breakdowns That Turn Raw Numbers Into Decisions
What turns a report into real decision support is not the totals but the way those figures are broken down correctly. Just as every department appears on a separate line in a company’s financial report, a clinic report needs to be broken down by user, period and channel. Three core breakdowns set Flextell reporting apart from an ordinary summary:
Breakdown by User (Doctor and Assistant)
A summary of the clinic as a whole gives only a superficial answer to “How are things going?” The real value is that the report can be broken down by doctor or assistant. How full is each doctor’s calendar, which treatments do they focus on, what is the level of the patient interactions each assistant manages? This breakdown moves performance evaluation from a general impression to concrete data. When no user is selected, the report keeps working for the clinic as a whole; when one is selected, all the statistics reflect only the records related to that person.
Period Comparison
The data of a single period cannot tell you on its own whether the clinic is getting better or worse. Meaning comes from comparison. Flextell reporting can compare a period with the one before it: the last 30 days with the previous 30 days, the last week with the previous week. In addition, two periods can be chosen independently; for example, you can compare this year’s January with the same period last year. The AI calculates the percentage change for each metric, interprets whether it is an increase or a decrease and offers a trend analysis. So the report shows not only where you are today but also which direction you are heading.
Breakdown by Channel
Patients reach the clinic through different channels: WhatsApp, Instagram, Telegram. How much conversation and message traffic each channel produces, and which one turns into more appointments, is directly valuable for marketing and communication decisions. The channel breakdown makes each channel visible separately, making it easier for the clinic to direct its energy to the most efficient channel.
Curious how all channels are managed in a single panel? You can find our guide to omnichannel patient communication here.
Automatic and Regular Reporting
The value of reporting is not limited to producing a report by hand only when you need it. In Flextell, reports can be scheduled to be generated automatically on a daily, weekly or monthly basis. Instead of preparing the report by hand at the end of every month, the clinic manager regularly receives a ready, interpreted report.
The generated reports can be exported as PDF, which makes it easy to share them in team meetings, archive them or include them in accounting processes. The time spent collecting data disappears; all that is left is making the decision.
Which Clinics Benefit Most From AI Reports?
AI reporting creates value for clinics of every size, but some profiles get a larger share of that value.
Independent clinics aiming to grow: Thanks to period comparison, you can clearly see whether growth is real and which months were strong and which weak.
Laser hair removal and session-based treatment centers: No-show distribution and period comparison show at which points patients are lost in repeating sessions.
Multi-doctor polyclinics: In setups with several doctors, the breakdown by user grounds performance and fill-rate tracking in concrete data; imbalances between doctors are noticed early.
Aesthetic and beauty clinics: Revenue analysis by treatment and the channel breakdown show which procedure and which social media channel earns more; the marketing budget is guided by data.
Frequently asked questions
Do I need technical knowledge to prepare an AI report?
No. Creating a report is just choosing the scope (period and systems) and starting the request. The whole process of collecting, analyzing and interpreting data is run automatically by the system.
What happens if the report gives a wrong result?
The report is produced from the clinic data entered into the system. When missing or incorrect data is entered, the report reflects that. That is why keeping treatment definitions, doctor profiles and appointment records current is critical for the report’s accuracy.
Can I create a report for just one topic (for example only appointments)?
Yes. You can limit the report scope to just the systems you choose. Even when you select a single system, the report produces a meaningful interpretation; it evaluates the data it has together with background context.
Can I compare one period with another?
Yes. The system can automatically compare your chosen period with the one before it, and it also lets you choose two periods independently. A percentage change and a trend commentary are provided for each metric.
Can I receive reports automatically at regular intervals?
Yes. Reports can be scheduled to be produced automatically on a daily, weekly or monthly basis and exported as PDF.
What data does the report include?
Metrics such as appointment fill rate, no-show distribution, revenue by treatment and staff productivity are compiled from ten different system sources, including appointments, patients, treatments, doctors, messaging and support requests.
The Data Is Already Yours; Reporting Turns It Into Decisions
Clinics produce enough data to make decisions every day. What is missing is not data but a way to read it on time and in the right form. Manual analysis makes that way laborious and error-prone; AI reporting collects the same data in seconds, interprets it and puts an actionable picture in front of you.
In Flextell, reporting works as an integrated system with its breakdowns by user, period and channel, its automatic schedules and its AI-powered commentary. The result is a decision structure that runs your clinic on data, not on instinct.
If you want to see how all the modules of clinic management work together, you can look at our guide to clinic management software here.
This content was prepared by the Flextell team. Last updated: July 2026.